Dynamic Infrared Mapping of Human Skin

License: https://creativecommons.org/licenses/by/4.0/deed.en
M.G.Volovik*,**,***, S.A.Polevaia**
*Volga Federal Medical Research Center, Ministry of Health of Russia, Verkhne-Volzhskaya naberezhnaya St., 18, 603155, Nizhny Novgorod, Russia, e-mail: afanassy@mail.ru
**Nizhny Novgorod State Medical Academy, Minin and Pozharsky Sq., 10/1, 603950, Nizhny Novgorod, Russia, e-mail: s453383@mail.ru
***«Dignosys» Ltd, Pokryshkin St., 8\2,119602, Moscow, Russia, e-mail: info@dignosys.com
Abstract
Human skin infrared radiation reflects interaction of local and central mechanisms of thermal homeostasis. Each regulation level is exhibited in infrared responses to thermal exposure. A large sample of subjects with pathologies and in health was studied to investigate thermal pattern dynamics during thermal homeostasis recovery in skin after a standardized cold test. We obtained a normal infrared response curve in healthy skin which behaves logarithmically, invariant with respect to localization of the skin, and is distorted by pathology. These results provide accurate data for expert systems which identify pathologies by specific distortions in post-stimulus thermal homeostasis recovery.
Introduction
Thermal imaging is a highly effective technique for obtaining information on regulatory processes in living systems [1]. At the same time, the possibilities of modern thermal imaging equipment in IR mapping of biological tissues are insufficiently realized in biomedical research and clinical diagnostics [2,3].
A considerable number of recent studies has proven that thermal imaging is effective for non-invasive visualization of the microcirculatory response dynamic map based on spatial distribution of temperatures on the skin surface. Infrared (IR) patterns of human skin are determined primarily by its local and systemic blood flow regulation. Controlled thermal loads allow us to study thermoregulation mechanisms primarily by looking at the spatial and amplitude dynamics of thermal response. A number of publications have demonstrated the informative value of the cold test in this application [4,5].
A relevant avenue of research today is developing effective techniques for CNS disorders diagnostics that relies on a formalized description of thermal pattern dynamics during thermal homeostasis recovery in human skin after exposure to cold.
To overcome the gap between the realized and the potential possibilities of IR mapping in biomedical research, there is a need for development of new ways of collecting, processing and interpreting thermal imaging data. Based on the results of thermal imaging studies in skin, we formulated the framework for dynamic IR mapping of thermoregulatory processes in biological tissues.
The objective of this work was to study thermoregulatory processes in the human skin using our methodology of dynamic IR mapping.
Methodology
To develop our technique of dynamic IR mapping of human skin, we used a sample of 434 patients with various pathologies and 42 healthy subjects. The study fully conforms to the 1964 Declaration of Helsinki, as revised in October 2013 (Fortaleza, Brazil). All subjects or patients (or their legal guardians) signed voluntary informed consent forms agreeing to thermal imaging examination.
The studies were carried out on a Thermo Tracer TH-9100 thermal imager (NEC, Japan), operating in the 8–14 μm spectral region, sensitivity 0.025–0.03°C, with an error ±1%, resolution of an IR array of 320×240. The data were processed on a personal computer in Goratec Thermography Studio (GTS 5.1.1.011), infrared thermography software.
As a complex system, the skin's state depends on a set of endogenous and exogenous factors. Changes in environment temperature during functional thermal tests are defined as exogenous factors whereas the state of skin and of nerve tracts responsible for thermoregulation is regarded as endogenous. We have analyzed thermal pattern dynamics in human skin during thermal homeostasis recovery after a cold test for three configurations of endogenous factors (figure 1): 1) healthy skin area and intact thermoregulation nerve tracts (a); 2) disruption of one or several links in the thermoregulation system (b, c); 3) damaged skin with intact thermal regulation (d).
Exogenous contexts were designed experimentally. An adequate evaluation of the state of the thermoregulatory system requires careful selection of functional tests [6]. Such tests allow us to include individual links in the thermoregulation loop, and to obtain a quantitative representation of their adaptation-compensatory resources.
To assess the functional state of the thermoregulation system, more than 20 tests (some well-known, some created for the experiment) were used to trigger the thermoregulation mechanisms (figure 2).
In the circuit of the figure 2, determine: left - the main groups of tests; center inside the red dotted line - the thermoregulation loop; right - the structures to which the effects are made. The proposed circuit allows selecting specific functional tests for each level in the thermoregulation contours for the purpose of shifting the stationary state and, thus, triggering thermoregulation processes in controlled effector structures. For the level of thermosensitive skin receptors in physiological and clinical conditions, such tests were the temperature probes, as well as local occlusion, for peripheral nervous system - types of sympathetic block, for the spinal level - spinal anesthesia and sympathectomy, for suprasegmentary structures - general anesthesia.
Two main types of cold tests were used. In the first case, the test consisted in immersing a segment of a limb into a tank with room-temperature water (20–22°C) for 1 minute, followed by measuring post-stimulus IR emission dynamics for 7 minutes (in healthy subjects) and longer (in patients with disrupted innervation or blood circulation in the tested skin area). An alcohol test was used as "soft" cold exposure: 70% ethanol was evenly sprayed onto a skin area until its temperature decreased by at least 3°C, followed by post-stimulus IR measurement for 3 minutes (healthy subjects) and longer (patients with a pathology).
Results and discussion
In order to identify thermal responses specific for different endogenous configurations, we needed to determine typical IR dynamics of cold test recovery and establish regularities in distortion of IR dynamics at known level of nerve tract disruption.
It has been demonstrated that application of a physiologically adequate cold stimulus in cases of healthy nerve regulation and healthy skin induces standard thermal responses. Significant effects have been identified in healthy subjects related to the location of the tested area and the number of test repetition in a data array that comprises a sequence of absolute temperature values measured at an increment of 1 s. Analysis of dispersion showed a reliably high correlation between temperature changes in response to the cold test in different skin area locations. Thermal response structure is invariable across locations of tested healthy skin which is reflected in an identical sequence of stages on the typical curve of post-stimulus temperature recovery despite different spatiotemporal, and amplitude response patterns (figure 3) [7].
The IR response curve in healthy skin has been obtained [3]. In physiological conditions, the curve exhibits 5 phases: 1) temperature decrease; 2) passive temperature increase; 3) active temperature increase; 4) reactive hyperthermia; 5) normal fluctuations (identical to pre-stimulus stable state of the system). Each phase is a function of dynamically changing variables of endogenous and exogenous nature. Specific features of the phases are related to activity of different regulation levels. We believe that the key variables include temperature, time, and surface area of stimulus application, initial temperature of the tested skin area, and the state of resistance vessels (arteries, arterioles) and sympathetic innervation of the tested area at different levels of the multilevel thermoregulation system.
It is obvious that spatiotemporal and amplitude characteristics of IR response to the cold test represent dynamic modes of the thermoregulation system. The onset of systemic response can be observed in the post-stimulus IR patterns through temperature changes in a symmetrical skin area where the behavior of IR response curve first represents the phase independent of the stimulus and then shows activity of blood flow regulation on the systemic level.
The curve of IR response to the cold test is universally applicable as a visualization of mechanisms of local and central skin thermoregulation. Universality of dynamic curve is corroborated by models built on cases where information exchange between the control and executive structures in impaired due to a pathology or experimental settings. Comparison of current IR readings with the reference curve of healthy (typical) skin response allows us to identify the nature and degree of change at different levels of the thermoregulation system (figure 4).
The role of different levels in the control circuit of the thermoregulation system can be determined by analyzing the impact of variables in experimental settings – e.g., narcotization – on the recovery curve behavior. Thus, for 20 and 30 minutes of Nembutal anesthesia in the rat, the initial temperature of the cooled area of the skin as well as the amplitude characteristics of the IR signal are gradually decreasing up to the complete distortion of the course of the recovery curve (figure 5).
It has been established that healthy recovery after the cold test follows a logarithmic law, whereas any degree of impairment in the systemic mechanisms manifests itself in deviation from a logarithmic towards a linear dependence (figure 6).
For the upper curve (figure 6) corresponding to the thermal reaction in the norm, the logarithmic dependence of the growth rate of temperature on time with the value of the approximation accuracy R2 = 0.9868 is observed; for the middle curve (skin with the scar-compressed nerve with reduced conductivity) the logarithmic dependence with R2 = 0.9461 still predominates; and for the lower curve corresponding to the reaction in the innervating zone of the fully interrupted nerve a linear dependence with R2 = 0.9483 predominates.
This logarithmic dependence of temperature increase on recovery time reveals non-linearity in manifestation of objective physiological mechanisms in IR emission behavior of tissue during thermoregulation. In our case, in the norm, there is a manifestation of a fundamental regularity, which inevitably must be distorted in the event of a violation in any module of the thermoregulatory circuit.
Complete interruption of the connection between control and effector structures results in the normal distribution; if temperature dynamics do not align with the normal distribution, this represents preservation of the component of active regulation.
Mapping IR reactivity models for all skin areas opens a possibility of creating a thermal topography atlas of a healthy human, who has an entirely intact thermoregulation system. IR mapping of intact skin, obviously, provides a record of the state of the healthy thermoregulation system and, as such, means that any deviation from the regular thermal response curve after the cold test will indicate a regulation impairment. Provided all levels of nerve regulation are intact, measuring the dynamic modes of a functional skin microcirculatory system allows us to evaluate adaptation and compensation resources of a given skin area. Thus, regression analysis of curves of IR response to the cold test makes it possible to evaluate the blood supply to various scarred areas: we have identified degradation of the logarithmic dependence of the rate of temperature rise on the time in data taken on scarred tissue relative to healthy skin (figure 7, top-down) [8].
In healthy skin, this enables evaluation of the nature and degree of change on various levels of the nervous system through comparison of IR readings with the reference curve (e.g., peripheral neuropathy or damage of spinal or suprasegmental modules in the thermoregulatory control system). The cold test triggers thermoregulation, whereas the manifestation of main thermoregulation phases and their reduction or distortion reflect functional structure disorders at various levels of the thermoregulation system. Standardized thermal provocations (functional tests) designed to test previously known targets in the thermoregulation system and blood flow control loops increase the specificity of thermal imaging. This approach transforms the method into a tool that allows studying the state not only for the skin, but also for the nervous regulation of the intradermal blood flow along the entire path of signal transmission in the thermoregulatory system. Additional evaluation of the structural and functional state of nerves and vessels by reference instrumental diagnostic methods (laser Doppler flowmetry, electroneuromyography, etc.) for the study of models of various pathologies makes it possible to differentiate the triggering mechanisms and the regulation contours of adaptation-compensatory reactions.
The proposed model of IR dynamics of the response to the cold test has made it possible for the first time to study the dependency of peripheral blood flow reactivity under prolonged regional anesthesia on the age of a child; to establish the criteria for functional assessment of peripheral blood flow regulation in health, in cases of blocked nerve conductivity under spinal anesthesia, periaxonal blockade of peripheral nerves, diabetic neuropathy, anatomical interruption of peripheral nerves, and disorders of nerve regulation of blood flow at various levels [9].
Further research should focus on identifying physiological mechanisms and specific features of thermal pattern dynamics in human skin during thermal homeostasis recovery after exposure to cold in cases of neural regulation impairment. It is expected that a guideline can be designed based on a description of the curve segments accompanied by a diagram showing the healthy range and various degrees of deviation linked to concrete known disorders.
REFERENCES
- Polevaia SA, Volovik MG, Khyzhnyak EP. [Dynamic Infrared mapping of human integuments]. Nonlinear dynamics in cognitive studies – 2017, Proceedings of the V All-Russian Conference, Nizhny Novgorod, IAP RAS, September 25-29, 2017, pp. 172-175, 2017. Russian.
- Diakides M. Infrared imaging, In: Biomedical signals, imaging and informatics, Ed. by J.D.Bronzino, D.R.Peterson. Boca Raton: CRC Press Taylor & Francis Group, Boca Raton, U.S.A., Ch. III, 2015.
- Kastek M, Piatkowski T, Polakowski H, et al. Intraoperative application of thermal camera for the assessment of during surgical resection or biopsy of human’s brain tumors, Thermosense: Thermal Infrared Applications XXXVI, edited by Fred P. Colbert, Sheng-Jen (Tony) Hsieh, Proceedings of SPIE, 9105: 910508-1, 2014.
- Wright CI, Kroner CI, Draijer R. Non-invasive methods and stimuli for evaluating the skin’s microcirculation, Journal of Pharmacological and Toxicological Methods. 54(1):1-25, 2006.
- Krupatkin AI, Sidorov VV. [Functional diagnostics of microcirculatory-tissue systems. Oscillations, information, nonlinearity. A guide for doctors]. Book House Librocom, Moscow, Russian.
- Volovik MG. [Dynamic infrared mapping of thermoregulatory processes in biological tissues]. Author's abstract. Doctoral Thesis, Doctor of Biological Sciences, Pushchino, 45 p., 2016. Russian.
- Volovik MG, Polevaya SA, Khomyakova MI. Cold test for thermal-vision studies of symmetrical reactions in physiology and medical diagnosis, Journal of Optical Technology. 80(6):393-399, 2013.
- Korotkova NL, Volovik MG. Thermal imaging assessment of cicatrical tissue capabilities in facioplasty planning, Modern Technologies in Medicine. 7(2):120-125, 2015.
- Volovik MG, Kolesov SN. The basis for choosing functional tests in medical thermal vision (using an alcohol test as an example), Journal of Optical Technology. 82(7):445-454, 2015.
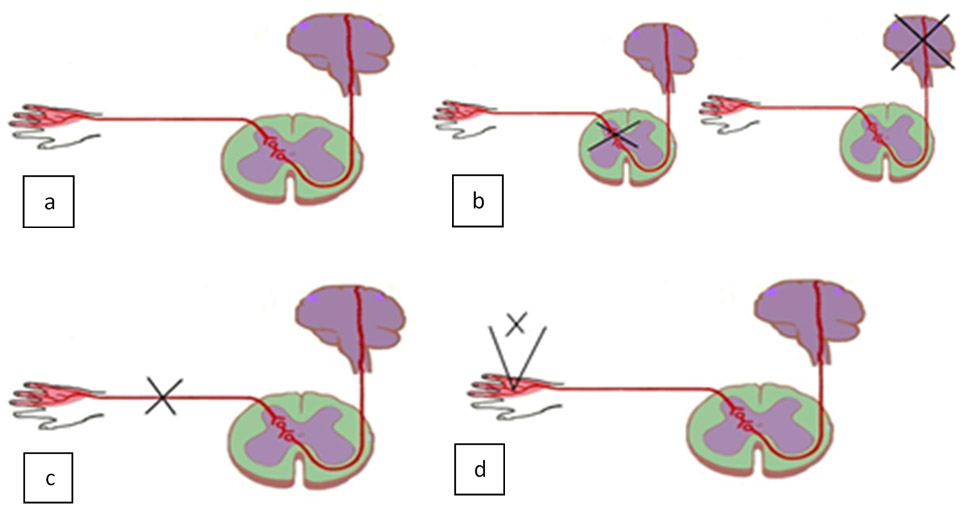
Fig. 1. Endogenous Contexts.
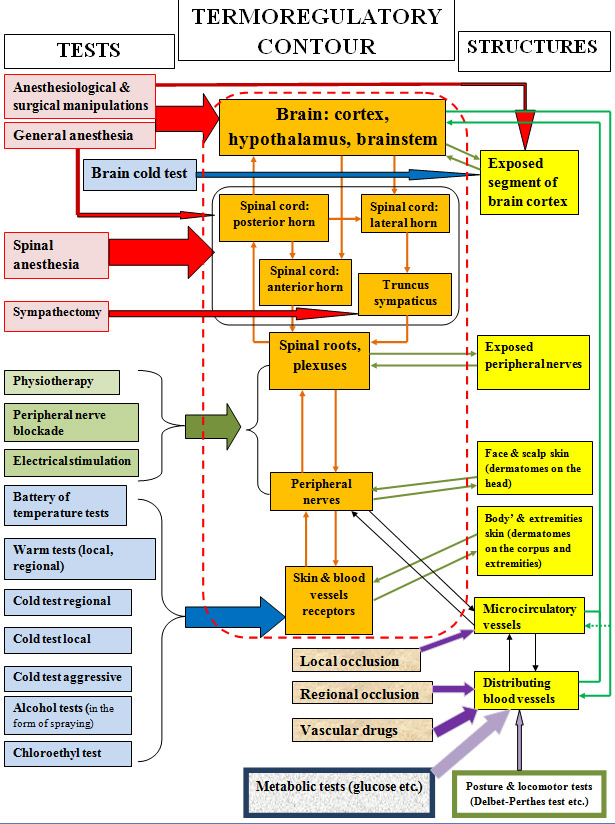
Fig. 2. Functional test circuit.
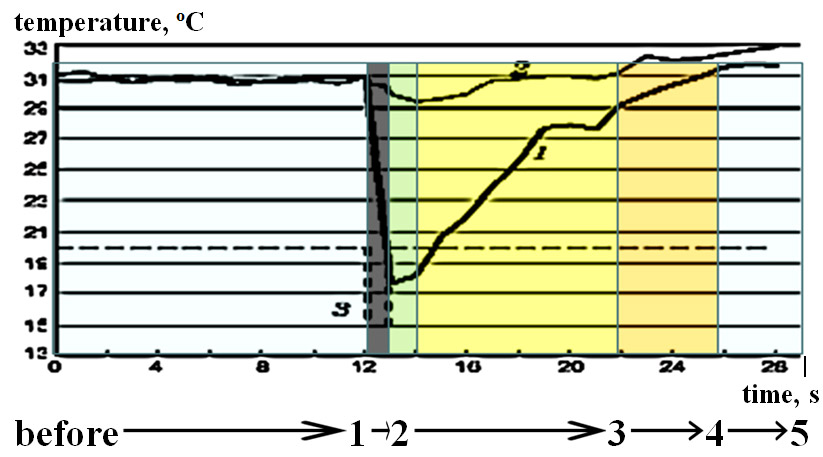
Fig. 3. A typical curve of the IR radiation dynamics in response to a standardized cold test in the stimulated (1) and symmetric non-stimulated (2) areas of the skin on the fingers (in healthy participants). Shift on line 3 represents refrigerant exposure time on the stimulation.

Fig. 4. Distorted regimes of thermoregulation. a. Violation of the active component of the response to cooling (phase 3) in the innervation zone before the nerve is blocked by lidocaine (red curve) and when blocked by lidocaine (black curve). b. Absence of signs of active regulation (phases 3-5) in thermal reaction to bilateral cooling of hands in the innervation zone of the interrupted nerve (green curve); black curve – thermal reaction in a symmetrical area of the skin on a healthy arm. Negative values on the X axis are the baseline before the test. The black arrow indicates the moment of a stimulus application.

Fig. 5. Left: thermal reaction to cold test in the rat skin at an early stage of rat anesthesia (Nembutal, 30 mg / kg, on the 10th minute). Right: thermal reaction to the cold test in the rat soles at different stages of anesthesia: for the 20th minute (blue curve); on the 30th minute (red curve). The X axis is the time in seconds, the Y axis is the temperature in оС. Black arrow indicates the moment of the stimulus application.
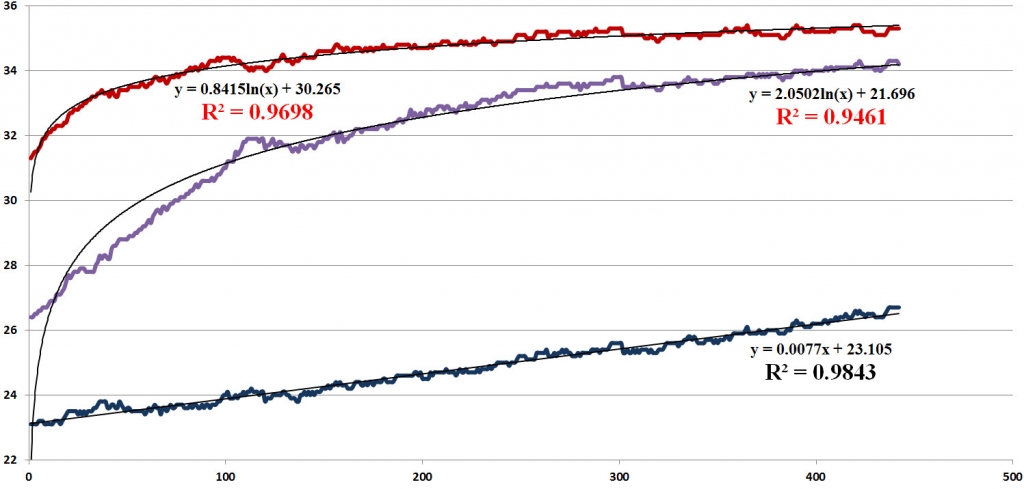
Fig. 6. Features of the thermal reaction dynamics during conduction disturbances in peripheral nerves. The phases of the curves are shown during the recovery phase. The upper curve is the norm (with holistic peripheral thermoregulation and healthy skin integuments); the middle curve is ischemic neuropathy; the lower curve is the complete interruption of the peripheral nerve. The reliability values of the approximation R2 for the logarithmic dependence are shown in red, the values for the linear dependence are shown in black. The X axis is the time in seconds, the Y axis is the temperature in оС.
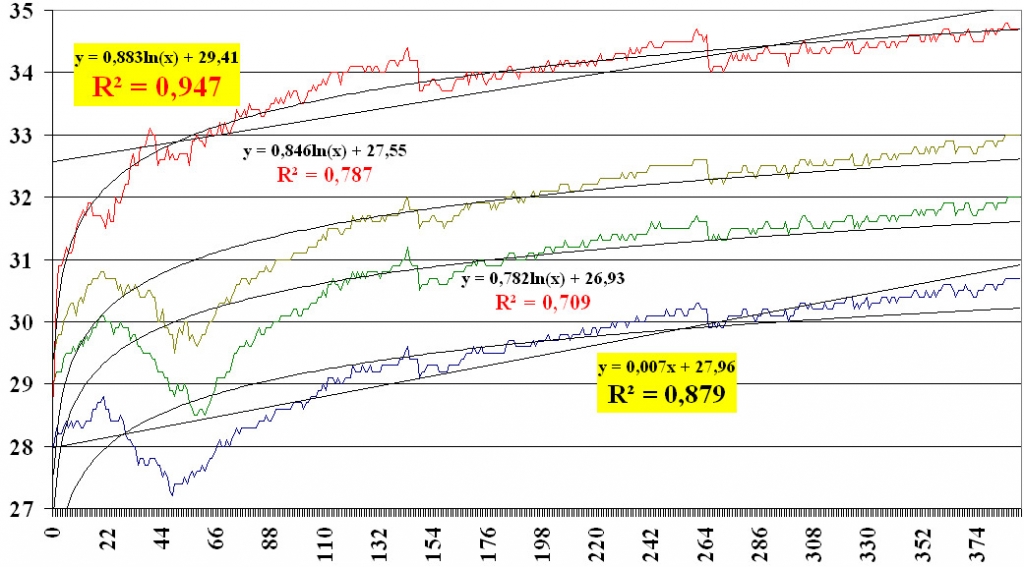
Fig. 7. Dynamics of IR response to cold test in the post-burn cicatrix skin areas. For notation see figure 6.

License: https://creativecommons.org/licenses/by/4.0/deed.en
